
Renewables and Decarbonation Projects Run at Different Speeds
In 2022, we could see how much Renewables and Decarbonation projects run at different speeds. Energy Transition market is booming, but this sector is not uniformed.
The two barre graphs below shows how Renewables projects and Decarbonation projects evolves year per year in term of capital expenditure. These bar graphs come from the projects database www.projectsmartexplorer.com

On the left, the first bar graph refers to Renewables, mainly Solar and Wind, projects. Then, on the right the second bar graph consolidates the capital expenditure in Decarbonation projects.
Decarbonation sector is much more complex than Renewables as it covers large variety of technologies, applications and processes. It starts with Electrification in AC or DC. It continues with carbon capture, usage and storage (CCUS) and Hydrogen (blue or green). But it also includes all the eAmmonia, eMethanol, eFuels, BioDiesel, BioPlastics, Sustainable Aviation Fuel (SAF), Renewable Natural Gas (RNG), Energy Storage. More recently, Waste-to-Methanol (W2M), Waste-to-Hydrogen (W2H), Waste-to-Chemical (W2C), Waste-to-Plastics (W2P) extended even more this category.
In Renewables, the bar graph ramps up regularly since 2018, but may reach some plateau in 2025 unless new campaign of investments should be decided.
In opposite way, the investments in Decarbonation projects really took off later, but scale up much faster. Since 2020, they more than double year to year. They also exceed by far the Renewables capital expenditure.
When the graph is going down in 2025 and following, it does not mean that the market is declining, it reflects the visibility we have on projects on the future year. The further we look, the less visibility we have. Anyway the trend is there, the investments in Decarbonation projects should continue to grow up to 2030 before reaching a potential plateau.
Energy Transition Projects Geography Differs from Oil & Gas and Petrochemicals
In the previous news, we described how Oil & Gas and Petrochemical capital expenditure should continue to grow on the next decade. But the investments in Energy Transition projects should double or triple on the same period. The dynamic is not the same.
The geography of these projects is also different as illustrated by the maps below.

All the green dots on the map represent the projects locations for which the engineering, procurement and construction (EPC) contracts have been awarded in 2022. At the difference with Oil & Gas and Petrochemical projects, we can notice a concentration of these Energy Transition projects sanctions in Europe and USA. This map also highlights the dynamism of Middle-East countries where Saudi Arabia and United Arab Emirates intend to become world leaders in green Hydrogen with 50% of the global market in 2030.
Energy Transition Value Chain also Differs from Oil & Gas and Petrochemicals
Not only the Energy Transition projects locations are different from Oil & Gas and Petrochemical, but their respective value chain also ends up in different regions.
The picture below indicates on the first line where the Energy Transition projects are located in consolidated capital expenditure (Capex) per region. On the second line it gives the Capex split per region of the front end engineering and design (FEED) locations. On the third line, you can see the Capex split per region of the EPC contracts locations. By FEED location or EPC location, we consider the location of the office where the engineering company or contractor is doing the job.
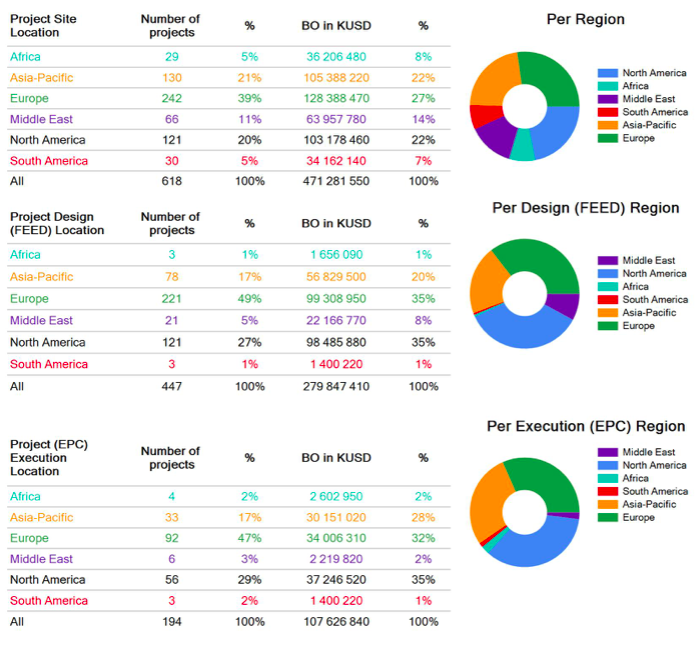
From these figures, it is very interesting to see how much the Energy Transition projects value chain is concentrated in Europe and USA. For the projects locations, Europe and USA attract 49% of the Capex. For the FEED, these two regions concentrate 70%, and of the EPC business they manage to retain 67% of the Capex in their hands.
The first reason behind this concentration in two regions relies in the large programs initiated by Authorities in place.
As a consequence, we observe the emergence of a new market structure in Energy Transition projects.
Energy Transition Projects Triggers the Emergence of New Operators and Contractors
In Renewables projects, we already noticed a decade ago the arrival of quantities of new players in the energy market, mainly in Europe for the Wind and in China for the Solar. The same phenomena seems to happen with Decarbonation projects, but at larger scale. Wind and Solar technologies have reached a certain level of maturity, it has become a manufacturer market where engineering companies have little added value, except in offshore wind where the solutions rise as much expectations as risks and uncertainties. In opposite way, Decarbonation technologies are still at their nascent phase motivating universities, start ups, new operators, new engineering companies, new manufacturers to develop and test their solutions.
The emergence of these new players appears in the diagram here below. Extracted from www.projectsmartexplorer.com , it shows how the Energy Transition projects Capex are split between the different categories of operators.
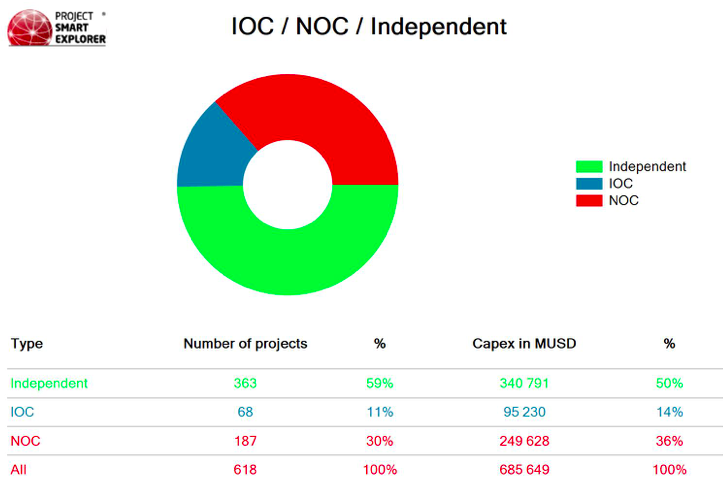
In this picture, the international oil companies (IOCs) represent 14%, the national oil companies (NOCs) 36% and the independent companies (ICs) 50%.
The score of the IOCs may be disappointing compared with their high level of investment in Energy Transition. But the other operators, especially the Independents are far more bullish, especially in Europe and USA.
Most of these independent companies were not existing a couple of years ago. They come from all horizons, energy, chemical, life sciences, agriculture, universities, wood, car, air transportation, waste, utilities..
Companies at the Source of Carbon Dioxide Emissions at the Source of Solutions
Many of them accepted the idea to be part of the problem of the carbon dioxide (CO2) emissions. Today, they intend to be part of the solutions. They expect to use these solutions for themselves first, then, to develop a new business model in the future.
As best evidence, we never measured that many demonstrators and pilot projects in 2022 compared with the last decade. These new processes at validation phase represent as many opportunities for business development. These projects run on fast-track. It just belongs to the most agile organizations to trace them and capture them.
Renewables and Decarbonation projects run at different speeds, just make sure your organization realized it and adjust the pace.
For more information on these Energy Transition projects, have a look into www.projectsmartexplorer.com![]()
![]()