
Global Energy Outlook on Q1 2024
Global Energy Outlook on Q1 2024 is part of our periodic exercise to release information about the dynamic of the various energy sectors. Based on the data collected into the projects global database www.projectsmartexplorer.com we cover Oil & Gas, Refining & Petrochemical and Energy Transition. According to our definition, Energy Transition includes projects in:
– Renewables, mainly solar, wind, nuclear energies, electrical energy storage.
– Decarbonation with its large scope of technologies (BioDiesel, BioGaz, electrification, e-Ammonia, e-Methanol, Carbon capture usage and sequestration (CCUS), Direct Air Capture (DAC), hydrogen, Renewable Diesel, Renewable Gasoline, Renewable Natural Gas (RNG), Sustainable Aviation Fuel (SAF), …)
– Recycling, appeared more recently, to create value out of wastes, including CO2, as per examples: waste-to-chemical, waste-to-plastic, waste-to-energy, waste-to-hydrogen.
By the way, most of these Decarbonation or recycling projects combine CO2 with hydrogen (H2) to create green chemical products.
Based on these definitions, you will find here below a picture of contracts awarded until Q1 2024. The reference year is the year when the engineering, procurement, and construction (EPC) contracts is sanctioned.
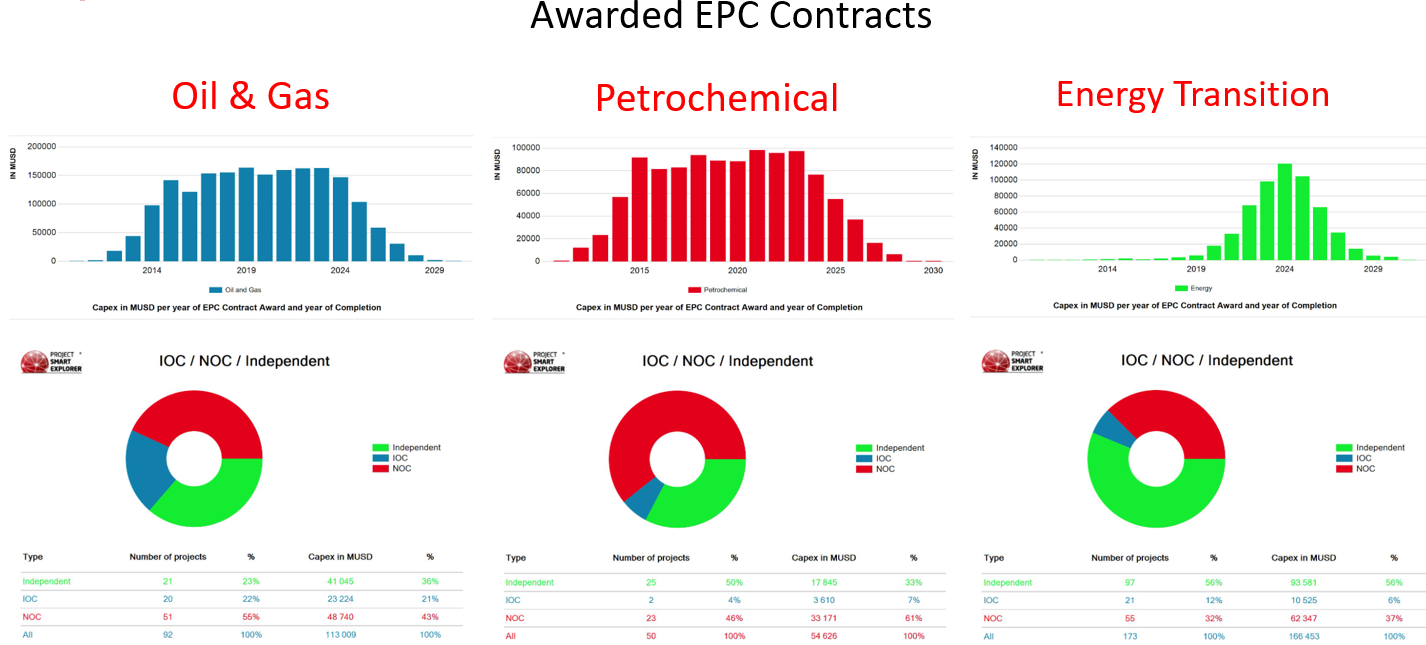
Since 2012, the barre graphs show year per year the volume of EPC contracts awarded until Q1 2024. These figures include the sanction of projects before Q1 2024, but for an execution later in 2024 or even in following years. That explains the decline of the graph after 2024 which has therefore nothing to do with a potential fall of investments in the future.
In opposite way, these graphs reflect the dynamism of all the energy sectors.
In Oil & Gas, the volume of awarded capital expenditure (Capex) is already very close to the entire last year.
For Refining & Petrochemical, the last three years were beating records, and obviously 2024 is on the way to continue the same trend.
Regarding Energy Transition, Q1 2024 actual figures are already exceeding the entire last year. More importantly, we can notice that they also pass over Refining & Petrochemical Capex.
From these figures, we can draw the following first conclusions:
1) The global demand remains robust fueling all energy sectors
2) This global demand is so strong, that Energy Transition investments does not substitute to other sectors but come on the top of them
The consequence of this situation appears on the colored rings below the barre graphs. These rings measure the market shares of the different types of operators in the three segments.
The Blue represents the international oil companies (IOCs) such as BP, ConocoPhillips, ExxonMobil, Shell, TotalEnergies, about 10 majors.
The Red refers to the national oil company (NOCs) such as Equinor, Petronas, Petrobras, or Saudi Aramco and many more.
The Green illustrates some hundreds independent companies (ICs), such as Air Liquide, Basf, Ineos or Perenco and many more. Most of these ICs do not benefit from a high visibility yet, as they emerged on the early 2020s.
Compared with last year, we observe that the IOCs are boosting Oil & Gas. The NOCs dominate always more the Refining & Petrochemical sector. The ICs are leading the game in Energy Transition, they are the game changers.
Energy Projects Geography
In the previous paragraph we have seen how much the profile of the leading operators is different depending on the energy sectors. Thus, these differences have an impact not only on the nature of the projects, but also on their geography.
On the Google map below, exported from www.projectsmartexplorer.com, the green dots represent the energy projects awarded on Q1 2024.
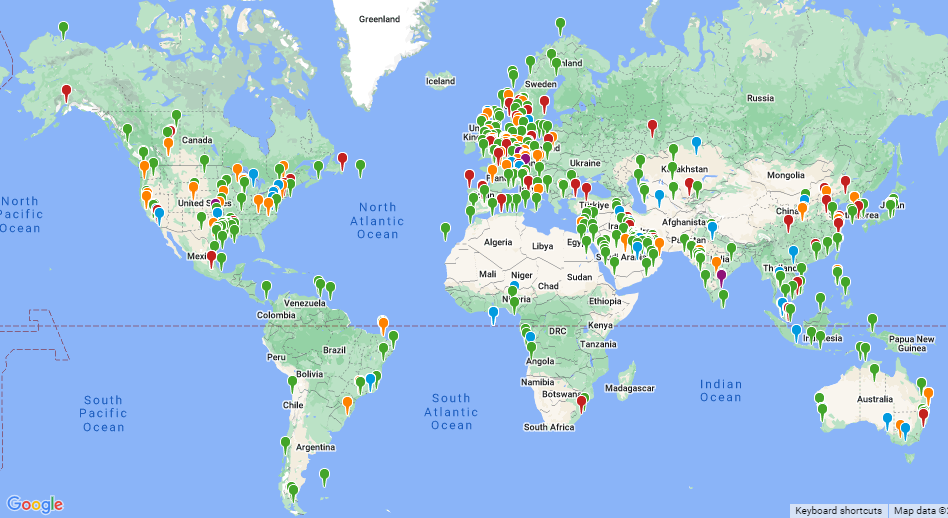
As usual, Middle East, Asia-Pacific appear as very active. But we can also see how much the other regions, Africa, South America, North America, and Europe concentrate massive investments in new projects.
In Europe, Q1 2024 confirms the trends we observed these last two years. The European Community leads the game in Energy Transition projects, especially in Decarbonation and Recycling. In addition, the old continent hosts most of the engineering companies working on these projects. The orange dots represent the offices performing the front end engineering and design (FEED). The red dots indicate the location of the contractors executing the EPC contracts.
After decades we saw Asia trusting FEED and EPC contracts, the Energy Transition helps to relocate projects design and execution in Europe and USA.
Perspectives for 2024
From the Global Energy Outlook on Q1 2024, we can draw some perspectives for the end of year.
The barre graph below is similar to the previous one above, but it represents the forecast of the final investment decisions (FIDs) to be made in 2024 and following years. Here again, the fact that these graphs go down after 2025 does not mean a market decrease, but the vision we have on these projects FIDs from today. The further we look at these projects, the less visibility we have on their related FIDs.
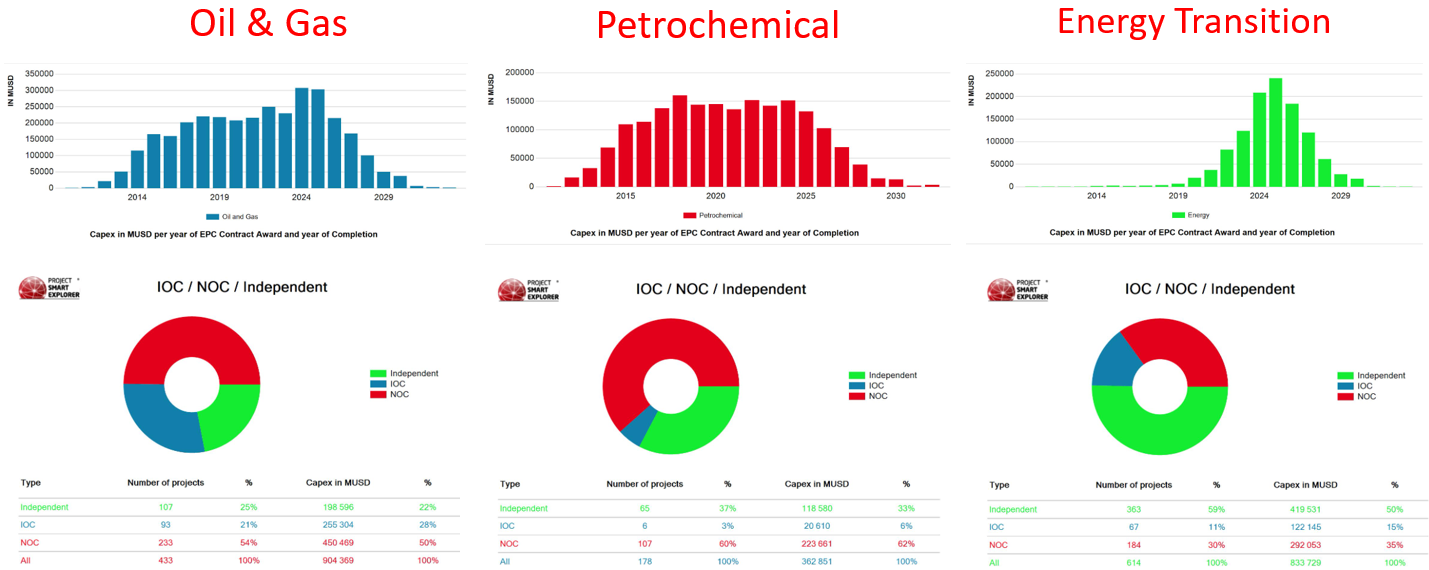
These graphs reflect actual FIDs until 2023, actual FIDs and forecast in 2024, and forecast for 2025 and beyond.
For Oil & Gas, the operators look very ambitious for 2024 and 2025, especially the IOCs who target to restore their 2015 market share. Unfortunately, we may face projects decisions delays or postponements as usual all along the year. Anyway, 2024 should exceed easily 2023 at the end of the year.
In Refining & Petrochemical, the NOCs, especially in Asia, are posting very high ambitions, but as usual, their respective government may not approve all the FIDs. At the year end, this sector should stand on the same line as last year.
In this picture, Energy Transition appears again as the champion of the investments as it should nearly double again compared with 2023. Some projects may be delayed, but some others should replace them and be executed on fast track. The game changers are really proceeding.
To know more about these game changers, have a look into www.projectsmartexplorer.com
![]()
![]()